Impermanent Loss Calculator: How to Calculate DeFi Risks and Protect Your Liquidity
 May, 2 2026
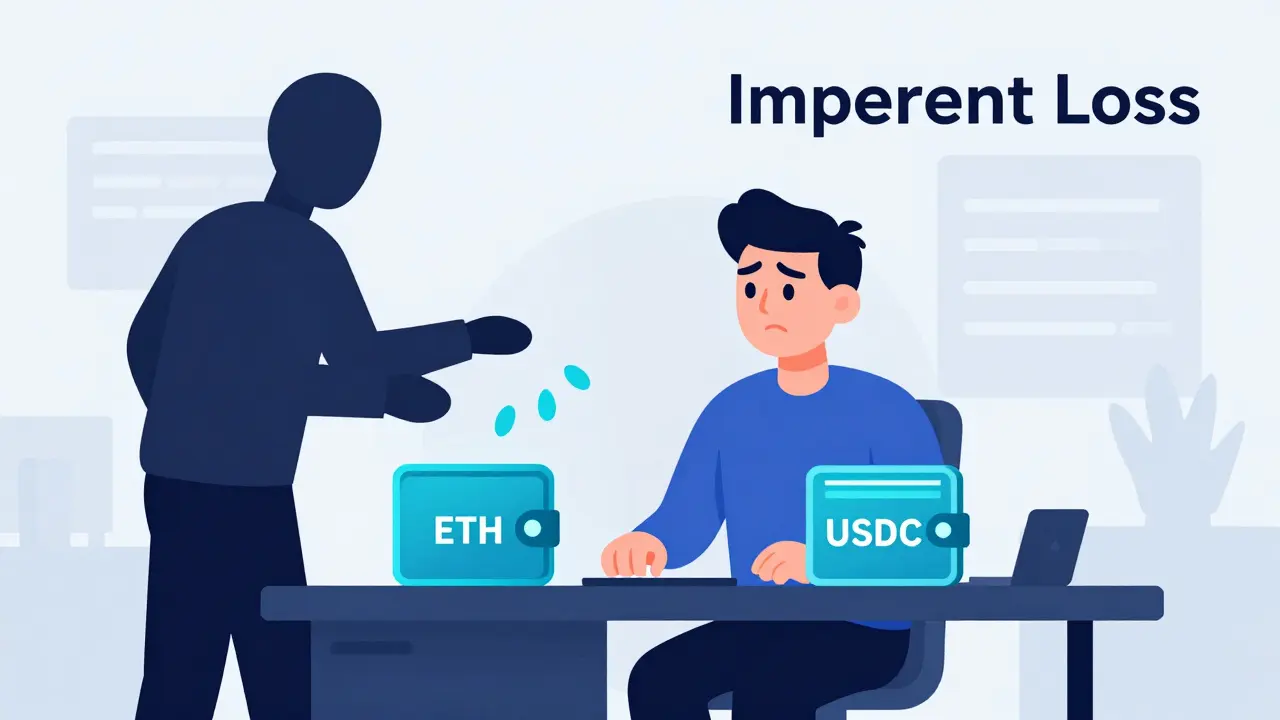
Imagine depositing $10,000 worth of Ethereum and USDC into a Liquidity Pool, expecting steady passive income. Two weeks later, you check your wallet. The numbers look wrong. You haven't been hacked, and the smart contract didn't fail. Yet, if you were to withdraw your funds right now, you’d have less money than if you had simply held those tokens in your cold storage. This is the silent killer of decentralized finance (DeFi): Impermanent Loss.
For anyone looking to become a Liquidity Provider on platforms like Uniswap or SushiSwap, understanding this concept is non-negotiable. It’s not just theory; it’s math that dictates whether you profit or lose capital. That’s why a reliable Impermanent Loss Calculator isn’t just a nice-to-have tool-it’s essential infrastructure for protecting your portfolio in 2026.
What Is Impermanent Loss and Why Does It Happen?
To use a calculator effectively, you first need to understand the engine behind the loss. Most decentralized exchanges operate as Automated Market Makers (AMMs). Unlike traditional stock exchanges with order books, AMMs use a mathematical formula-usually the constant product formula ($x \times y = k$)-to price assets.
When you provide liquidity, you deposit two assets in equal value (e.g., $5,000 ETH and $5,000 USDC). As traders buy and sell against your pool, the ratio of these assets changes. If ETH’s price skyrockets, traders will buy ETH from your pool, paying with USDC. Your pool ends up holding more USDC and less ETH. Conversely, if ETH crashes, your pool holds more ETH and less USDC.
The "loss" occurs because the value of this rebalanced portfolio is lower than the value of the original assets if you had just held them statically. It is called "impermanent" because if the prices of both assets return to their original ratio, the loss disappears. However, if you withdraw during divergence, the loss becomes permanent.
| Term | Definition | Impact on LP |
|---|---|---|
| AMM | Algorithm that sets prices based on pool ratios | Determines how assets are rebalanced |
| Price Divergence | Change in relative asset prices | Causes impermanent loss |
| Trading Fees | Earnings from swaps (e.g., 0.3%) | Offsets potential losses |
| Concentrated Liquidity | Liquidity provided within specific price ranges (Uniswap V3) | Higher capital efficiency but higher IL risk |
How an Impermanent Loss Calculator Works
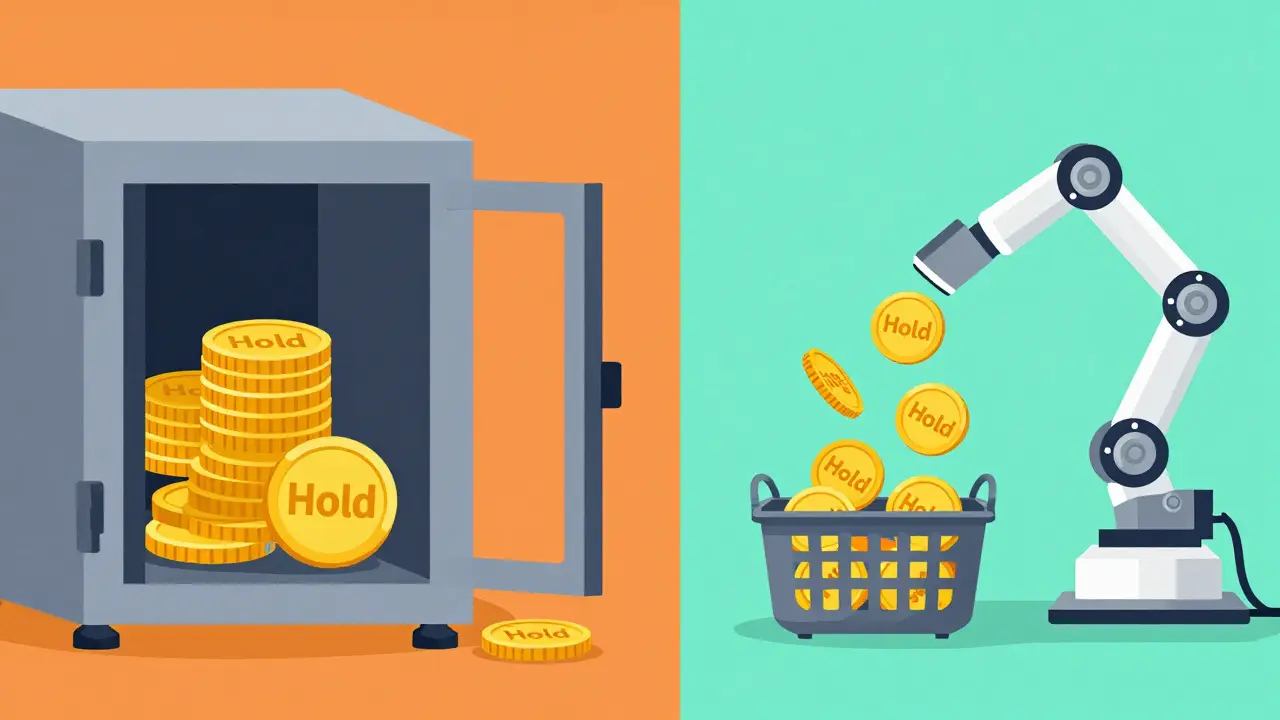
A Impermanent Loss Calculator quantifies this opportunity cost. It compares two scenarios:
- Scenario A: You hold the assets in your wallet without providing liquidity.
- Scenario B: You provide liquidity, and the AMM algorithm rebalances your position based on current market prices.
The calculator uses the initial price ratio and the current price ratio to determine the difference in total USD value between Scenario A and Scenario B. Advanced calculators also factor in Trading Fees. Since liquidity providers earn fees on every trade, these earnings can offset the impermanent loss. The real question isn’t just "how much did I lose?" but "did my fee earnings cover the loss?"
For example, if ETH doubles in price, a standard 50/50 pool might show an impermanent loss of roughly 9.5%. If the pool’s trading volume generates 10% in fees over the same period, you are still net positive. Without a calculator, guessing this break-even point is nearly impossible.
Types of Calculators: Which One Should You Use?
Not all calculators are created equal. In 2026, the landscape has matured significantly since the early days of DeFi Summer. Here is how they stack up:
1. Basic Web-Based Tools
Sites like impermanentloss.com offer simple interfaces where you input the initial and current prices. They are great for quick checks but often lack integration with real-time fee data. According to industry reviews, these tools can have error margins up to 40% during high-volatility events because they don’t account for complex pool dynamics.
2. Exchange-Native Integrations
Platforms like Balancer and updated versions of Uniswap now embed calculators directly into their user interfaces. These are more accurate because they pull live data from the specific pool you’re targeting, including historical volatility and current fee structures. They are ideal for active traders who want real-time feedback before confirming transactions.
3. Institutional-Grade Suites
For large-scale investors, tools from providers like Amberdata offer predictive modeling using machine learning. These platforms analyze millions of price updates per second and project potential losses over various time horizons. While expensive (often costing thousands monthly), they provide up to 95% accuracy in backtested scenarios, making them vital for hedge funds managing significant TVL.
Step-by-Step: Using a Calculator to Make Decisions
Here is how you should approach using a calculator before entering any pool:
- Identify the Pair: Determine which assets you want to pair. High-correlation pairs (like ETH/wETH) have near-zero impermanent loss. Low-correlation pairs (like ETH/USDC) carry higher risk.
- Input Historical Data: Enter the price at which you plan to enter. For advanced planning, use the 30-day average price rather than the spot price to reduce noise.
- Set Price Scenarios: Don’t just look at the current price. Run simulations for +20%, -20%, and +50% price movements. This shows your worst-case exposure.
- Factor in Fees: Input the expected annualized fee revenue. If a pool offers 50% APR but has a 10% impermanent loss risk, the net gain is 40%. If the IL risk spikes to 60%, you are losing money despite the high APR.
- Check Concentration Ranges: If using Uniswap V3, narrow ranges amplify returns but drastically increase impermanent loss sensitivity. Use the calculator to see how small price wicks can knock you out of range.
Risks and Limitations of Current Tools
While invaluable, calculators are not crystal balls. They rely on historical data and mathematical models that assume rational market behavior. During black swan events-like the banking crises of early 2023-volatility spikes can render standard calculations inaccurate.
Furthermore, most free calculators ignore Smart Contract Risk. A calculator might show a profitable position, but if the underlying protocol has a vulnerability, your entire principal could be drained. Always combine calculator outputs with security audits from firms like OpenZeppelin or Trail of Bits.
Another limitation is the assumption of static liquidity. In reality, other providers may withdraw or add funds, changing the pool’s depth and your proportional share. Institutional tools mitigate this by simulating dynamic liquidity flows, but retail users must remain cautious.
Strategies to Mitigate Impermanent Loss
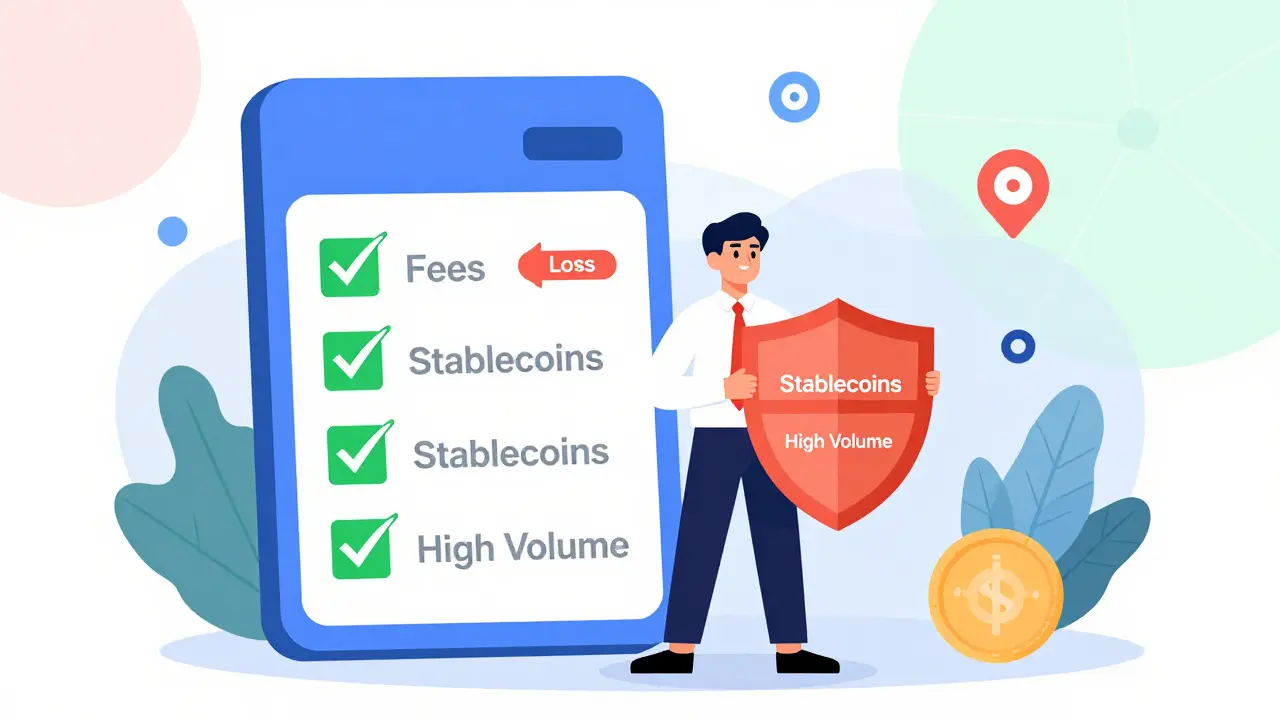
You can’t eliminate impermanent loss entirely, but you can manage it:
- Stablecoin Pairs: Providing liquidity for pairs like USDC/USDT minimizes price divergence, resulting in negligible impermanent loss. The primary risk here is depegging, not IL.
- High-Fee Pools: Target pools with high trading volumes. Higher fees compensate for moderate price swings.
- Long-Term Holding: If you believe in the long-term appreciation of an asset, impermanent loss is less relevant if you never withdraw. The "loss" only materializes upon exit.
- Use Options Vaults: Some protocols offer hedged liquidity positions where options strategies offset potential downside risks.
The Future of Liquidity Risk Management
As we move through 2026, the line between calculators and active risk management is blurring. Wallets like MetaMask are experimenting with pre-transaction warnings that estimate impermanent loss in real-time. AI-driven models are beginning to predict short-term volatility clusters, allowing providers to adjust their positions proactively.
The goal is no longer just calculation-it’s automation. Expect to see more "self-balancing" pools that automatically adjust concentration ranges based on predicted volatility, reducing the manual burden on liquidity providers.
Is impermanent loss really permanent?
No, it is only permanent if you withdraw your liquidity while the price divergence exists. If the prices of the two assets revert to their original ratio, the impermanent loss disappears, and your portfolio value matches what it would have been if you had held.
Can trading fees completely offset impermanent loss?
Yes, in high-volume pools, trading fees can exceed the impermanent loss, resulting in a net profit even if the asset prices diverge significantly. This is why calculating the "break-even" fee rate is crucial before providing liquidity.
Which liquidity pools have the lowest impermanent loss?
Pools consisting of stablecoins (e.g., USDC/USDT) or wrapped versions of the same asset (e.g., ETH/wETH) have near-zero impermanent loss because the price ratio remains relatively constant.
Do Uniswap V3 calculators work differently than V2?
Yes. Uniswap V3 uses concentrated liquidity, meaning you provide funds within a specific price range. Calculators for V3 must account for this range; if the price moves outside your range, you may incur higher impermanent loss or stop earning fees entirely.
Should I use a free or paid calculator?
For most retail users, free exchange-native calculators are sufficient. Paid institutional tools are necessary only if you are managing large sums of capital ($100k+) and require predictive analytics and multi-exchange data aggregation.
Rachel S
May 2, 2026 AT 19:24I have been providing liquidity since the early days of Uniswap V2, and I can tell you that this post hits the nail on the head regarding the silent killer of DeFi portfolios. :o It is so easy to get swept up in the hype of a 50% APR without realizing that the impermanent loss will eat your principal alive if the market moves against you. The section about concentrated liquidity in Uniswap V3 is particularly important because many retail users do not realize how much risk they are taking by narrowing their price ranges. You might think you are getting better capital efficiency, but you are actually exposing yourself to massive IL if the price wicks just slightly outside your range. I always recommend using stablecoin pairs like USDC/USDT if you want steady returns without the heartburn of watching your portfolio value fluctuate wildly. It is not glamorous, but it is safe. The math never lies, and ignoring it is a recipe for disaster. We need more people educating themselves on these mechanics before they throw money into random pools. Thank you for writing this clear guide. It is exactly what the community needs right now. ~
Wayne Gillis
May 3, 2026 AT 13:03Bro really thought he could explain basic AMM mechanics without mentioning smart contract risk properly 🤡 Like sure, IL is bad, but have you seen the number of rugs lately? 💀 Your calculator doesn't matter if the dev pulls the rug out from under you. Also, who uses those institutional tools for $10k? That's wild. Just stick to the basics or don't touch DeFi at all. 📉🔥
Noel Mandotah
May 3, 2026 AT 14:45The article is fine but let's be real. Most people here don't know what an AMM is. They just see green numbers and click approve. Pathetic.
Tracy McBurney
May 5, 2026 AT 00:50You seem to have missed the entire point of the constant product formula. If you cannot grasp the mathematical inevitability of rebalancing losses, you should not be touching any liquidity pool. The notion that fees alone will save you is statistically improbable for the average user who lacks the computational resources to model volatility accurately. Furthermore, your suggestion to use stablecoin pairs ignores the systemic risk of algorithmic depegging events which have historically wiped out billions. It is frankly alarming that you would advocate for such simplistic strategies without addressing the underlying structural vulnerabilities of the protocols themselves. Educate yourself before offering financial advice.
AP Fisher
May 6, 2026 AT 00:50I guess I am just confused about why we even bother with these calculators if the market is so unpredictable. I tried using one last week and the numbers changed every minute. It felt like trying to catch water in my hands. Maybe I am just too old for this tech stuff. But I liked the part about holding long term. If I never sell, does it really matter if I lost money on paper? That makes sense to me. Simple and clean. No stress.