Support and Resistance in Crypto Trading: A Practical Guide to Price Levels
 Aug, 23 2026
Ever watched a Bitcoin chart bounce off the exact same price three times in a row? That isn't luck. It’s support and resistance at work. These two concepts are the backbone of technical analysis in cryptocurrency markets, helping traders predict where prices might stall, reverse, or explode in one direction. Unlike traditional stocks that trade during specific hours, crypto moves 24/7 with high volatility, making these psychological price zones even more critical for navigating the chaos.
You don’t need a PhD in math to use them. You just need to understand how human psychology drives market behavior. When thousands of traders look at the same chart, they place orders at the same obvious levels. This creates invisible walls and floors that shape the entire market structure. Let’s break down how these levels form, why they matter, and how you can use them without getting trapped by false signals.
What Actually Defines Support and Resistance?
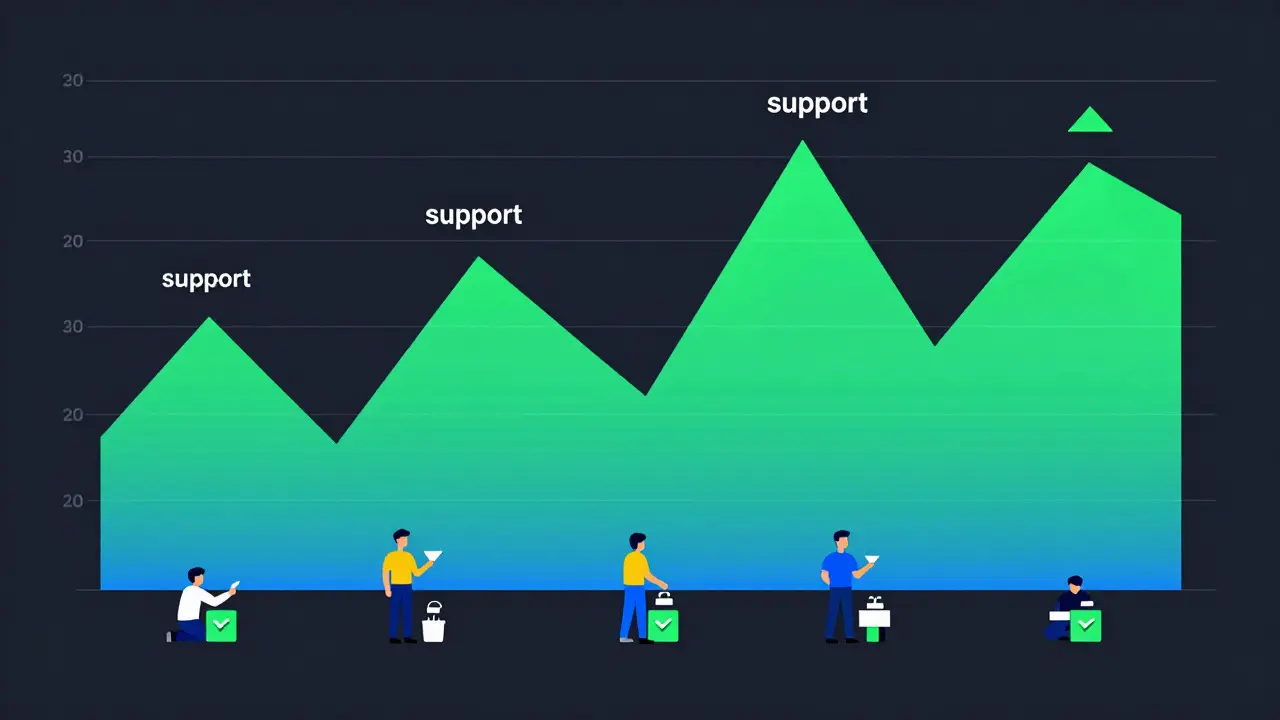
Support is a price level acting as a floor where buying demand emerges to prevent further price decline. Think of it as a safety net. If Bitcoin drops to $60,000 and buyers step in aggressively because they see value there, that price becomes support. The stronger the support, the more times price has bounced off it previously. Each bounce reinforces the idea that "this is a good price to buy."
Resistance is a price ceiling where selling pressure outweighs buying interest, preventing upward movement. This happens when early buyers who bought low want to take profits, or new sellers enter the market thinking the price is too high. If Ethereum struggles to break above $3,500 multiple times, that zone becomes resistance. Sellers defend this line, pushing the price back down whenever it gets close.
Here is the key insight: these aren’t single lines on a graph. They are zones. Markets are messy. Price often wicks slightly through a level before reversing. Treating them as rigid lines leads to premature stop-losses. Treat them as areas of interest where supply and demand battle each other.
The Psychology Behind the Price Walls
Why do these levels exist? It comes down to memory and emotion. Traders anchor to past prices. If you missed buying Bitcoin at $50,000 last month, you’re likely waiting for it to return to that level so you can jump in. Conversely, if you sold at $70,000 and the price went higher, you’re watching that level hoping to buy back in at breakeven. This collective behavior creates liquidity pools.
Stop-loss orders play a huge role here. Most traders place their stop-losses just below support or just above resistance. Sophisticated algorithms and large players know this. They often push price briefly beyond these levels to trigger those stops, creating a "liquidity hunt" before reversing the trend. This is why you see sharp spikes that seem irrational but actually serve a purpose: clearing out weak hands before the real move begins.
- Anchoring Bias: Traders fixate on round numbers like $100,000 or previous highs/lows.
- Fear and Greed: Fear drives selling at resistance; greed drives buying at support.
- Order Clustering: Large institutional orders sit at obvious levels, creating thick walls of volume.
How to Identify Strong Levels on Your Chart
Not all support and resistance levels are created equal. Some are weak blips; others are concrete barriers. To identify the ones that matter, look for confluence. This means multiple factors aligning to signal importance.
- Count the Touches: The more times price has reacted to a level, the stronger it is. A level touched five times is far more significant than one touched twice.
- Check the Timeframe: Levels on weekly or monthly charts carry more weight than those on 15-minute charts. Multi-timeframe alignment provides the highest probability setups.
- Look at Volume: High trading volume at a specific price point indicates heavy participation. If price bounces off a level with massive volume, that bounce is likely genuine.
- Identify Round Numbers: Psychological milestones like $1,000, $10,000, or $100,000 act as natural magnets for orders.
If you combine a major weekly support level with a recent local resistance zone, you have a high-probability area to watch. This is where you should be placing your alerts and preparing your trades.
The Flip: When Support Becomes Resistance
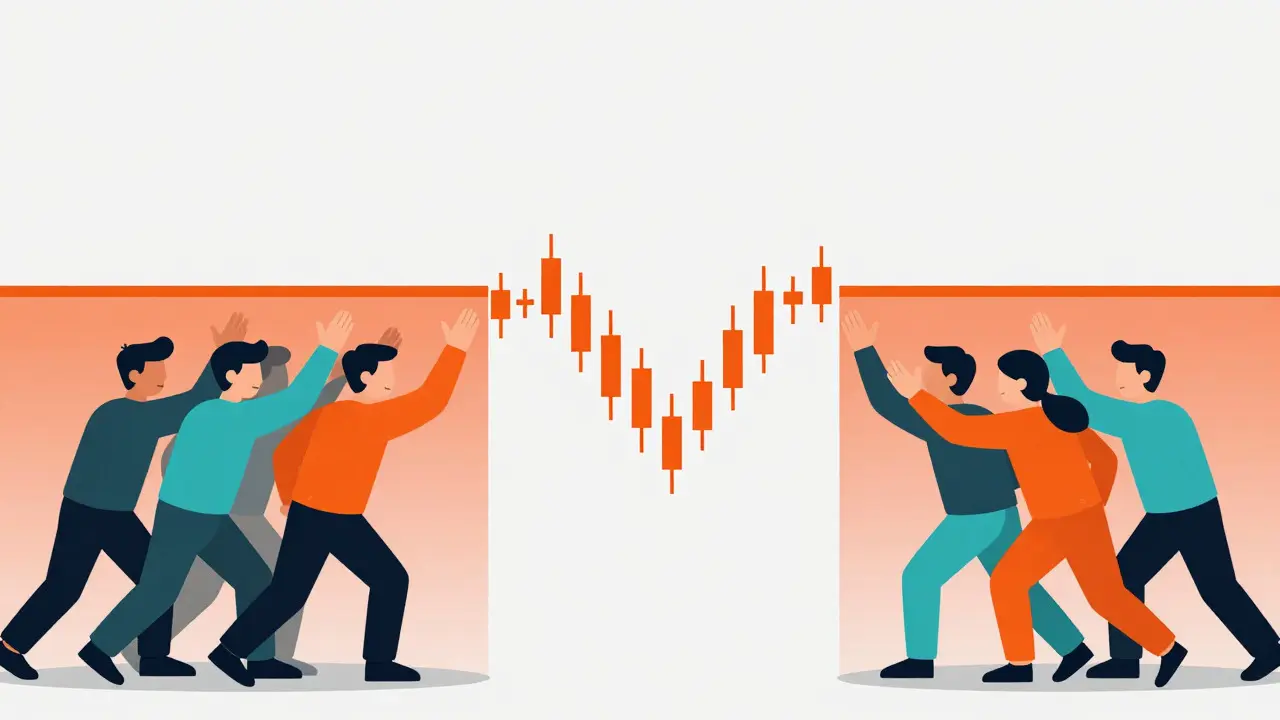
One of the most confusing aspects for new traders is the "flip." When price breaks through a resistance level, that old ceiling often becomes new support. Why? Because traders who were waiting to buy above the resistance now feel validated. They buy in, creating a new floor. Similarly, when support breaks, it often turns into resistance. Traders who bought at that support level are now underwater, and they will try to sell at breakeven to escape their losses.
This concept is crucial for trend following. In an uptrend, every time price pulls back to a former resistance (now support), it offers a safer entry point than chasing the price higher. Understanding this flip helps you stay with the trend rather than fighting against it.
Breakouts vs. False Breakouts
A breakout occurs when price moves decisively beyond a support or resistance level and holds there. This usually signals a shift in market sentiment. For example, if Bitcoin breaks above $70,000 resistance and stays there for several days, it suggests buyers are in control and the next leg up may begin.
However, false breakouts are common in crypto. Price wicks above resistance, triggers stop-losses from short sellers, and then snaps back down. How do you tell the difference?
| Feature | Real Breakout | False Breakout |
|---|---|---|
| Volume | High volume confirms the move | Low volume or spike followed by drop |
| Candle Close | Closes clearly beyond the level | Wicks beyond but closes back inside |
| Momentum Indicators | RSI/MACD show strong directional bias | Indicators remain neutral or diverge |

Combining With Other Indicators for Better Accuracy
Using support and resistance in isolation is risky. They tell you *where* price might react, but not *how strongly*. Combining them with momentum indicators filters out low-quality signals.
For instance, if price approaches a strong support level and the Relative Strength Index (RSI) shows bullish divergence (price makes a lower low, but RSI makes a higher low), the probability of a reversal increases significantly. Similarly, if price hits resistance and MACD (Moving Average Convergence Divergence) shows a bearish crossover, it confirms that downward momentum is building.
These combinations create a checklist for your entries:
- Price at key support/resistance zone.
- Momentum indicator confirms direction.
- Volume supports the move.
- Multi-timeframe alignment exists.
Common Mistakes to Avoid
Even experienced traders fall into traps. Here are the most common ones:
- Chasing the Move: Entering a trade after the price has already moved significantly away from the level. Always wait for a pullback or retest.
- Ignoring Context: A support level in a strong downtrend is weaker than one in an uptrend. Always assess the broader trend first.
- Overcrowding: If everyone sees the same level, it becomes a target for manipulation. Be aware that obvious levels are often hunted.
- Static Thinking: Levels change. As price moves, new highs and lows create fresh support and resistance. Update your chart regularly.
Jennifer Ulmer
August 23, 2026 AT 14:27It is really interesting how much of this comes down to human memory. We are just creatures who remember prices and feel emotions about them. That creates the patterns we see on charts. It makes sense that support is like a floor where people feel safe buying. And resistance is like a ceiling where people get scared or greedy. I like the idea that these are zones and not just lines. It helps explain why price wicks so much. We all look at the same numbers so it makes sense they become important. The part about stop-losses being hunted is a bit scary but logical. Big players know where everyone else is hiding their exits. It feels less like magic and more like psychology. This guide does a good job explaining the basics without making it sound too complicated. It is nice to have a practical view on something so volatile.
Jade Brown
August 25, 2026 AT 02:46Oh, let's dive into the abyss of technical analysis shall we?
You talk about 'zones' as if the market isn't a bloody casino run by whales with infinite liquidity pools.
Support and resistance are just psychological anchors for retail degens who think they can time the bottom.
The real alpha is in order flow and delta divergence, not some pretty line you drew on TradingView.
But sure, keep telling yourself that $60k is a 'safety net' while your bags turn to dust.
The flip concept is cute until you realize that broken support becomes resistance only if volume confirms it, which it rarely does in a bear trap.
Most of what you call 'confluence' is just confirmation bias dressed up in jargon.
We are all just gamblers staring at candles hoping the next one is green.
Don't get me wrong, it's better than nothing, but don't mistake a heuristic for a law of physics.
The market doesn't care about your RSI divergence when a macro shock hits.
Keep dreaming though, it keeps the volume up for the smart money to exit into.
Claudio Perrone
August 26, 2026 AT 15:45this is deep bro. like really deep.
it makes you think about the nature of reality itself.
are we just puppets dancing to the rhythm of supply and demand?
i feel like i am seeing the matrix now.
the walls are not real they are made of fear and greed.
just like my life right now.
everything is a level.
even my sleep schedule has support and resistance.
its beautiful and terrifying at the same time.
i might trade my kidney for eth based on this.
what do you guys think?
is it worth it?
the pain of holding vs the pain of selling.
philosophical dilemma of the century.
anyway thanks for the post it changed my worldview slightly.
or maybe just my mood today. hard to tell.
Hicham Mounir
August 27, 2026 AT 05:24This is such a great breakdown! I really appreciate how you explained the psychology behind it. It makes the whole thing feel so much more approachable. I used to be so intimidated by these concepts because they felt so abstract. But seeing it through the lens of human behavior really clicks. It reminds us that markets are driven by people, after all. Thank you for sharing this perspective!
michelle aguilar
August 28, 2026 AT 17:41Finally! A post that actually understands the nuance! -- Most people miss this entirely; it's quite frustrating, honestly. The section on false breakouts is... essential, truly. One must never forget the importance of volume confirmation! -- Or else, one is merely gambling, which is a sad state of affairs for most traders. I find that many lack the discipline required to wait for the close. Patience is a virtue, indeed! -- And yet, so few possess it. It is a testament to our collective impatience, wouldn't you agree? -- Anyway, well done on the comprehensive overview. It was a pleasant read, despite the usual noise in this space.
Lance Konig
August 30, 2026 AT 02:35Good points, but you're missing the macro context. Technicals only work within a regime. If the Fed hikes again, your support levels are irrelevant. Price action is a lagging indicator of fundamental shifts. Don't get too attached to the chart. The bigger picture always wins in the long run. Stay disciplined.